GeForce GTX 1650 Ti vs Radeon PRO WX 3100
In this comparison between GeForce GTX 1650 Ti and Radeon PRO WX 3100 you will find out which graphics card performs better in today's games. Bear in mind that third-party versions may have more efficient cooling and higher clock speeds. This will increase cards' performance, though not by much. In addition to raw power you should also take into account the dimensions. Thicker models simply will not fit into a small mini-ITX case. The resolution of your monitor also affects the choice, since 4K gameplay requires a more powerful GPU. And don't overspend on the graphics card. Other parts of your build may also need to be upgraded, save some money for the CPU or power supply. For some people GeForce GTX 1650 Ti will be the best choice, for others Radeon PRO WX 3100 will be their preference. Study the comparison tables below and make your choice.
GeForce GTX 1650 Ti

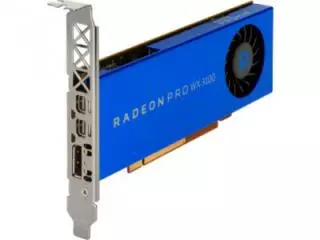
Radeon PRO WX 3100 is a Laptop Graphics Card
Note: Radeon PRO WX 3100 is only used in laptop graphics. It has lower GPU clock speed compared to the desktop variant, which results in lower power consumption, but also 10-30% lower gaming performance. Check available laptop models with Radeon PRO WX 3100 here:
Main Specs
| GeForce GTX 1650 Ti | Radeon PRO WX 3100 | |
| Power consumption (TDP) | 75 Watt | 65 Watt |
| Interface | PCIe 3.0 x16 | PCIe 3.0 x8 |
| Supplementary power connectors | None | None |
| Memory type | GDDR5 | GDDR5 |
| Maximum RAM amount | 4 GB | |
| Display Connectors | 1x DVI, 1x HDMI, 1x DisplayPort | 1x DisplayPort, 2x mini-DisplayPort |
| Check Price |
- GeForce GTX 1650 Ti has 15% more power consumption, than Radeon PRO WX 3100.
- GeForce GTX 1650 Ti is connected by PCIe 3.0 x16, and Radeon PRO WX 3100 uses PCIe 3.0 x8 interface.
- GeForce GTX 1650 Ti is used in Desktops, and Radeon PRO WX 3100 - in Mobile workstations.
- GeForce GTX 1650 Ti is build with Turing architecture, and Radeon PRO WX 3100 - with Polaris.
- GeForce GTX 1650 Ti is manufactured by 12 nm process technology, and Radeon PRO WX 3100 - by 14 nm process technology.
- Memory clock speed of GeForce GTX 1650 Ti is 2000 MHz higher, than Radeon PRO WX 3100.
Game benchmarks
| high / 1080p | 35−40 | 14−16 |
| ultra / 1080p | 24−27 | 8−9 |
| QHD / 1440p | 20−22 | 3−4 |
| 4K / 2160p | 10−12 | − |
| low / 720p | 65−70 | 27−30 |
| medium / 1080p | 45−50 | 16−18 |
| The average gaming FPS of GeForce GTX 1650 Ti in Assassin's Creed Odyssey is 178% more, than Radeon PRO WX 3100. | ||
| high / 1080p | 60−65 | 21−24 |
| ultra / 1080p | 50−55 | 18−20 |
| QHD / 1440p | 35−40 | 5−6 |
| 4K / 2160p | 20−22 | 4−5 |
| low / 720p | 110−120 | 45−50 |
| medium / 1080p | 65−70 | 24−27 |
| The average gaming FPS of GeForce GTX 1650 Ti in Battlefield 5 is 195% more, than Radeon PRO WX 3100. | ||
| low / 768p | 50−55 | 45−50 |
| QHD / 1440p | 0−1 | 0−1 |
| The average gaming FPS of GeForce GTX 1650 Ti in Call of Duty: Warzone is 10% more, than Radeon PRO WX 3100. | ||
| low / 768p | 250−260 | 200−210 |
| medium / 768p | 220−230 | 170−180 |
| ultra / 1080p | 190−200 | 90−95 |
| QHD / 1440p | 120−130 | 50−55 |
| 4K / 2160p | 75−80 | 30−33 |
| high / 768p | 210−220 | 130−140 |
| The average gaming FPS of GeForce GTX 1650 Ti in Counter-Strike: Global Offensive is 58% more, than Radeon PRO WX 3100. | ||
| low / 768p | 60−65 | 55−60 |
| ultra / 1080p | − | 35−40 |
| medium / 1080p | 55−60 | 45−50 |
| The average gaming FPS of GeForce GTX 1650 Ti in Cyberpunk 2077 is 15% more, than Radeon PRO WX 3100. | ||
| low / 768p | 120−130 | 100−110 |
| medium / 768p | 110−120 | 90−95 |
| ultra / 1080p | 100−110 | 60−65 |
| The average gaming FPS of GeForce GTX 1650 Ti in Dota 2 is 33% more, than Radeon PRO WX 3100. | ||
| high / 1080p | 50−55 | 16−18 |
| ultra / 1080p | 45−50 | 14−16 |
| QHD / 1440p | 30−35 | − |
| 4K / 2160p | 16−18 | 5−6 |
| low / 720p | 85−90 | 35−40 |
| medium / 1080p | 50−55 | 16−18 |
| The average gaming FPS of GeForce GTX 1650 Ti in Far Cry 5 is 183% more, than Radeon PRO WX 3100. | ||
| high / 1080p | 65−70 | 21−24 |
| ultra / 1080p | 50−55 | 18−20 |
| QHD / 1440p | 30−35 | 16−18 |
| 4K / 2160p | 27−30 | − |
| low / 720p | 190−200 | 90−95 |
| medium / 1080p | 120−130 | 45−50 |
| The average gaming FPS of GeForce GTX 1650 Ti in Fortnite is 141% more, than Radeon PRO WX 3100. | ||
| high / 1080p | 65−70 | 21−24 |
| ultra / 1080p | 50−55 | 18−20 |
| QHD / 1440p | 35−40 | 8−9 |
| 4K / 2160p | 24−27 | − |
| low / 720p | 110−120 | 45−50 |
| medium / 1080p | 70−75 | 24−27 |
| The average gaming FPS of GeForce GTX 1650 Ti in Forza Horizon 4 is 187% more, than Radeon PRO WX 3100. | ||
| low / 768p | 140−150 | 80−85 |
| medium / 768p | 130−140 | 70−75 |
| high / 1080p | 75−80 | 27−30 |
| ultra / 1080p | 35−40 | 10−12 |
| QHD / 1440p | 24−27 | 2−3 |
| The average gaming FPS of GeForce GTX 1650 Ti in Grand Theft Auto V is 115% more, than Radeon PRO WX 3100. | ||
| high / 1080p | 27−30 | 9−10 |
| ultra / 1080p | 21−24 | 7−8 |
| QHD / 1440p | 18−20 | − |
| 4K / 2160p | 10−11 | 2−3 |
| low / 720p | 75−80 | 27−30 |
| medium / 1080p | 35−40 | 12−14 |
| The average gaming FPS of GeForce GTX 1650 Ti in Metro Exodus is 191% more, than Radeon PRO WX 3100. | ||
| low / 768p | 130−140 | 110−120 |
| ultra / 1080p | − | 100−110 |
| medium / 1080p | 120−130 | 100−110 |
| The average gaming FPS of GeForce GTX 1650 Ti in Minecraft is 18% more, than Radeon PRO WX 3100. | ||
| high / 1080p | − | 21−24 |
| ultra / 1080p | 14−16 | 16−18 |
| low / 720p | 100−110 | 50−55 |
| medium / 1080p | 18−20 | 21−24 |
| The average gaming FPS of GeForce GTX 1650 Ti in PLAYERUNKNOWN'S BATTLEGROUNDS is 53% more, than Radeon PRO WX 3100. | ||
| high / 1080p | 27−30 | 14−16 |
| ultra / 1080p | 18−20 | 9−10 |
| QHD / 1440p | 12−14 | 0−1 |
| 4K / 2160p | 8−9 | − |
| low / 720p | 70−75 | 24−27 |
| medium / 1080p | 40−45 | 14−16 |
| The average gaming FPS of GeForce GTX 1650 Ti in Red Dead Redemption 2 is 150% more, than Radeon PRO WX 3100. | ||
| low / 768p | 140−150 | 50−55 |
| medium / 768p | 90−95 | 30−35 |
| high / 1080p | 50−55 | 16−18 |
| ultra / 1080p | 27−30 | 10−11 |
| 4K / 2160p | 18−20 | 8−9 |
| The average gaming FPS of GeForce GTX 1650 Ti in The Witcher 3: Wild Hunt is 179% more, than Radeon PRO WX 3100. | ||
| low / 768p | 90−95 | 100−105 |
| medium / 768p | 60−65 | 60−65 |
| ultra / 1080p | 55−60 | 30−35 |
| high / 768p | − | 50−55 |
| The average gaming FPS of GeForce GTX 1650 Ti in World of Tanks is 7% more, than Radeon PRO WX 3100. | ||
Full Specs
| GeForce GTX 1650 Ti | Radeon PRO WX 3100 | |
| Architecture | Turing | Polaris |
| Code name | TU117 | Polaris 12 |
| Type | Desktop | Mobile workstation |
| Release date | no data | 21 March 2017 |
| Pipelines | 1024 | 512 |
| Core clock speed | 1530 MHz | |
| Boost Clock | 1725 MHz | 1219 MHz |
| Transistor count | 4,700 million | 2,200 million |
| Manufacturing process technology | 12 nm | 14 nm |
| Texture fill rate | 39.01 | |
| Floating-point performance | 1,248 gflops | |
| Length | 229 mm | |
| Memory bus width | 128 Bit | 128 Bit |
| Memory clock speed | 8000 MHz | 6000 MHz |
| Memory bandwidth | 96 GB/s | |
| Shared memory | - | |
| DirectX | 12_1 | 12 (12_0) |
| Shader Model | 6.4 | |
| OpenGL | 4.6 | 4.6 |
| OpenCL | 2.0 | |
| Vulkan | 1.2.131 | |
| Laptop size | large | |
| Check Price |