Radeon R7 250 vs Radeon R9 290X
In this comparison between Radeon R7 250 and Radeon R9 290X you will find out which graphics card performs better in today's games. Bear in mind that third-party versions may have more efficient cooling and higher clock speeds. This will increase cards' performance, though not by much. In addition to raw power you should also take into account the dimensions. Thicker models simply will not fit into a small mini-ITX case. The resolution of your monitor also affects the choice, since 4K gameplay requires a more powerful GPU. And don't overspend on the graphics card. Other parts of your build may also need to be upgraded, save some money for the CPU or power supply. For some people Radeon R7 250 will be the best choice, for others Radeon R9 290X will be their preference. Study the comparison tables below and make your choice.
Main Specs
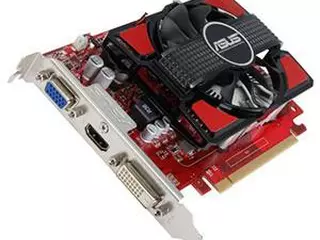
Radeon R7 250
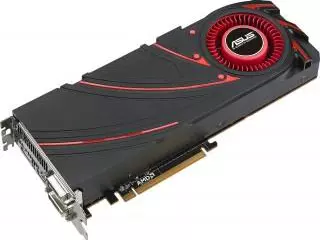
Radeon R9 290X
Power consumption (TDP)
75 Watt
250 Watt
Interface
PCIe 3.0 x8
PCIe 3.0 x16
Supplementary power connectors
N/A
1 x 6-pin + 1 x 8-pin
Memory type
DDR3, GDDR5
GDDR5
Maximum RAM amount
2 GB
4 GB
Display Connectors
1x DVI, 1x HDMI, 1x VGA
2x DVI, 1x HDMI, 1x DisplayPort
Check Price
Check Price
Radeon R9 290X has 233% more power consumption, than Radeon R7 250.
Radeon R7 250 is connected by PCIe 3.0 x8, and Radeon R9 290X uses PCIe 3.0 x16 interface.
Radeon R9 290X has 2 GB more memory, than Radeon R7 250.
Both cards are used in Desktops.
Radeon R7 250 and Radeon R9 290X are build with GCN architecture.
Radeon R7 250 and Radeon R9 290X are manufactured by 28 nm process technology.
Radeon R9 290X is 107 mm longer, than Radeon R7 250.
Memory clock speed of Radeon R9 290X is 100 MHz higher, than Radeon R7 250.
Game benchmarks
Assassin's Creed Odyssey
Battlefield 5
Call of Duty: Warzone
Counter-Strike: Global Offensive
Cyberpunk 2077
Dota 2
Far Cry 5
Fortnite
Forza Horizon 4
Grand Theft Auto V
Metro Exodus
Minecraft
PLAYERUNKNOWN'S BATTLEGROUNDS
Red Dead Redemption 2
The Witcher 3: Wild Hunt
World of Tanks
high / 1080p
3−4
35−40
ultra / 1080p
1−2
24−27
QHD / 1440p
0−1
18−20
4K / 2160p
−
10−11
low / 720p
14−16
60−65
medium / 1080p
5−6
45−50
The average gaming FPS of Radeon R9 290X in Assassin's Creed Odyssey is 616% more, than Radeon R7 250.
high / 1080p
6−7
60−65
ultra / 1080p
4−5
50−55
QHD / 1440p
0−1
35−40
4K / 2160p
−
18−20
low / 720p
18−20
110−120
medium / 1080p
7−8
65−70
The average gaming FPS of Radeon R9 290X in Battlefield 5 is 722% more, than Radeon R7 250.
low / 768p
50−55
50−55
high / 1080p
40−45
−
QHD / 1440p
0−1
0−1
Radeon R7 250 and Radeon R9 290X have the same average FPS in Call of Duty: Warzone.
low / 768p
120−130
250−260
medium / 768p
90−95
220−230
ultra / 1080p
45−50
190−200
QHD / 1440p
24−27
110−120
4K / 2160p
−
70−75
high / 768p
65−70
210−220
The average gaming FPS of Radeon R9 290X in Counter-Strike: Global Offensive is 183% more, than Radeon R7 250.
low / 768p
60−65
60−65
ultra / 1080p
21−24
−
medium / 1080p
40−45
55−60
The average gaming FPS of Radeon R9 290X in Cyberpunk 2077 is 15% more, than Radeon R7 250.
low / 768p
80−85
120−130
medium / 768p
55−60
110−120
ultra / 1080p
27−30
100−110
The average gaming FPS of Radeon R9 290X in Dota 2 is 105% more, than Radeon R7 250.
high / 1080p
4−5
45−50
ultra / 1080p
4−5
45−50
QHD / 1440p
−
30−35
4K / 2160p
2−3
16−18
low / 720p
14−16
85−90
medium / 1080p
5−6
50−55
The average gaming FPS of Radeon R9 290X in Far Cry 5 is 733% more, than Radeon R7 250.
high / 1080p
10−12
65−70
ultra / 1080p
7−8
50−55
QHD / 1440p
1−2
30−35
4K / 2160p
−
27−30
low / 720p
50−55
180−190
medium / 1080p
16−18
120−130
The average gaming FPS of Radeon R9 290X in Fortnite is 441% more, than Radeon R7 250.
high / 1080p
8−9
65−70
ultra / 1080p
7−8
45−50
QHD / 1440p
3−4
35−40
4K / 2160p
3−4
24−27
low / 720p
21−24
110−120
medium / 1080p
10−11
70−75
The average gaming FPS of Radeon R9 290X in Forza Horizon 4 is 566% more, than Radeon R7 250.
low / 768p
45−50
140−150
medium / 768p
35−40
130−140
high / 1080p
8−9
75−80
ultra / 1080p
4−5
30−35
QHD / 1440p
0−1
24−27
The average gaming FPS of Radeon R9 290X in Grand Theft Auto V is 304% more, than Radeon R7 250.
high / 1080p
2−3
27−30
ultra / 1080p
1−2
21−24
QHD / 1440p
−
18−20
4K / 2160p
0−1
9−10
low / 720p
9−10
70−75
medium / 1080p
4−5
35−40
The average gaming FPS of Radeon R9 290X in Metro Exodus is 900% more, than Radeon R7 250.
low / 768p
90−95
130−140
high / 1080p
85−90
−
ultra / 1080p
80−85
−
medium / 1080p
−
120−130
The average gaming FPS of Radeon R9 290X in Minecraft is 46% more, than Radeon R7 250.
ultra / 1080p
12−14
14−16
low / 720p
27−30
100−110
medium / 1080p
14−16
18−20
The average gaming FPS of Radeon R9 290X in PLAYERUNKNOWN'S BATTLEGROUNDS is 155% more, than Radeon R7 250.
high / 1080p
5−6
27−30
ultra / 1080p
3−4
18−20
QHD / 1440p
0−1
12−14
4K / 2160p
−
8−9
low / 720p
7−8
70−75
medium / 1080p
7−8
35−40
The average gaming FPS of Radeon R9 290X in Red Dead Redemption 2 is 550% more, than Radeon R7 250.
low / 768p
18−20
140−150
medium / 768p
12−14
90−95
high / 1080p
6−7
50−55
ultra / 1080p
4−5
27−30
4K / 2160p
0−1
16−18
The average gaming FPS of Radeon R9 290X in The Witcher 3: Wild Hunt is 690% more, than Radeon R7 250.
low / 768p
70−75
90−95
medium / 768p
35−40
60−65
ultra / 1080p
16−18
55−60
high / 768p
30−35
−
The average gaming FPS of Radeon R9 290X in World of Tanks is 66% more, than Radeon R7 250.
Full Specs
Radeon R7 250
Radeon R9 290X
Architecture
GCN
GCN
Code name
Oland XT
Hawaii XT
Type
Desktop
Desktop
Release date
1 October 2013
24 October 2013
Pipelines
384
2816
Boost Clock
1050 MHz
947 MHz
Transistor count
950 million
6,200 million
Manufacturing process technology
28 nm
28 nm
Texture fill rate
25.20
176.0
Floating-point performance
716.8 gflops
5,632 gflops
Length
168 mm
275 mm
Memory bus width
128 Bit
512 Bit
Memory clock speed
1150 MHz
1250 MHz
Memory bandwidth
72 GB/s
320 GB/s
Shared memory
-
-
Shader Model
5.1
6.3
OpenGL
4.6
4.6
OpenCL
1.2
2.0
Vulkan
+
Monero / XMR (CryptoNight)
0.76 kh/s
FreeSync
+
+
Bus support
PCIe 3.0
PCIe 3.0
HDMI
+
+
Bitcoin / BTC (SHA256)
117 Mh/s
623 Mh/s
Eyefinity
+
HD3D
+
TrueAudio
+
Design
reference
reference
DisplayPort support
+
CrossFire
+
+
DDMA audio
+
+
Decred / DCR (Decred)
1.07 Gh/s
Ethereum / ETH (DaggerHashimoto)
3 Mh/s
25.75 Mh/s
Zcash / ZEC (Equihash)
350 Sol/s
AppAcceleration
+
+
LiquidVR
+
TressFX
+
UVD
+
Check Price
Check Price